If we know the distance to a star and can measure its apparent magnitude (m) corrected for interstellar absorption, then we can find its absolute magnitude (M). The quantity (m-M) is called the distance modulus of a star and equals 5log10 (d/10), where d=10(m-M+5)/5 is its distance in parsecs. In 1905 Ejnar Hertzsprung (1873-1967) showed how a star’s luminosity (absolute magnitude) was related to the width of lines in its spectrum, thus establishing spectroscopic parallax (‘parallax’ here however is a misnomer), i.e. comparing absolute magnitude with apparent magnitude, as a means of distance-finding.
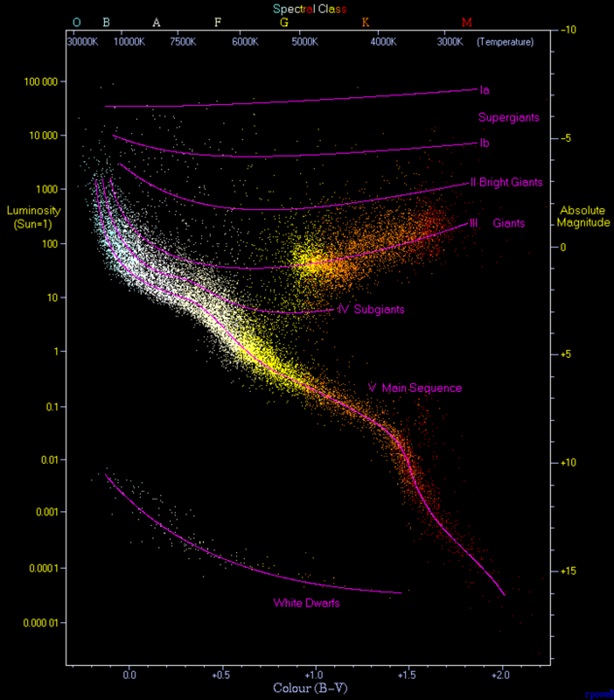
The spectral type of a star depends on its surface temperature (O, B, A, F, G, K and M the coolest), and hence is also a guide to its colour, the hottest stars being the bluest and coolest ones the reddest. Hertzsprung plotted absolute magnitude against the temperature (colour or spectral type) for the stars of the Pleiades. By 1910 Henry Norris Russell (1877-1957) had accumulated data on enough stars for him to plot a diagram of their absolute magnitude against their spectral type – unaware that Hertzsprung had done the same in 1906.
The graph has luminosity (or absolute magnitude) increasing upwards on the y-axis and the temperature (or spectral type/class or colour) decreasing to the right on the x-axis. The majority of stars lie in a band called the main sequence extending diagonally from the hot stars of high luminosity in the upper left side to cool stars of low luminosity in the lower right corner. Giant stars are stars that have swollen in size towards the end of their lives, having converted all the hydrogen in their cores into helium. On the diagram they form a thick horizontal band to the right of the middle of the main sequence. Above this there is a sparse horizontal band of supergiants. The lower left of the diagram is occupied by white dwarfs, dying stars that are thought to form from collapsed stellar cores when nuclear burning ceases.

By Richard Powell – The Hertzsprung Russell Diagram, CC BY-SA 2.5, https://commons.wikimedia.org/w/index.php?curid=1736396
Leave a Reply